Total score=30
number of students=9
Summary of Scores
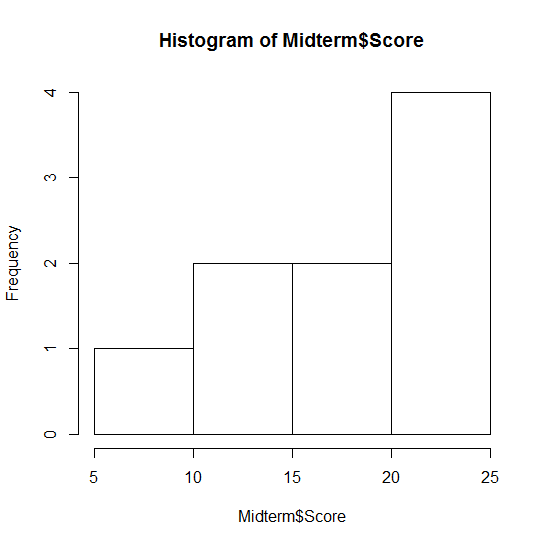
> summary(Midterm$Score)
Min. 1st Qu. Median Mean 3rd Qu. Max. 6.00 15.00 19.50 17.56 21.50 22.50
Histogram
> hist(Midterm$Score)