Total score=30
number of students=54
Summary of Scores
Min. 1st Qu.
Median Mean 3rd Qu. Max.
4.0 10.5 12.5 12.8 15.50 22.00
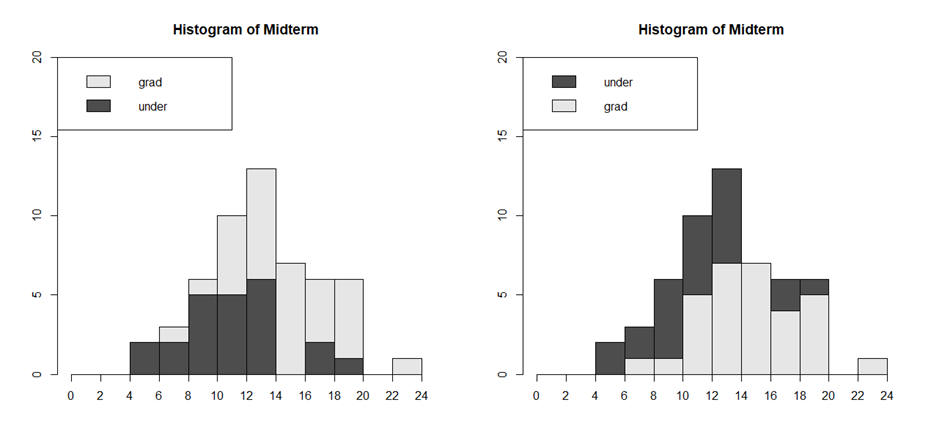
Histogram (grad: graduate students, under:
undergraduate students)
For each problem on this test, the number of students who received full credit: Q1: 50、Q2: 43、Q3: 11、Q5: 20、Q6: 8、Q7: 0、Q8: 18、Q9: 8、Q10: 0、Q11: 10、Q12: 41、Q13: 26、Q14: 4、Q15: 29、Q16: 41、Q17: 12、Q18: 4、Q19: 0、Q20: 5。