Fitting a Binomial GLM (Reading: Faraway (2006, 1st ed.), section 2.1~2.2)
Here is a
data set from a study of rubber O-ring seals in the rocket boosters of
space shuttle. Each shuttle had two booster, each with three O-rings. The data
recorded the number of O-rings out of six showing some damage due to blow by and
erosion in 23 previous shuttle missions. Because rubber becomes more brittle and
is a less effective sealant at lower temperatures, we are interested in how the
probability of failure in a given O-rings is related to the launch temperature.
We start by reading the data into R.
> orings <- read.table("orings.txt")
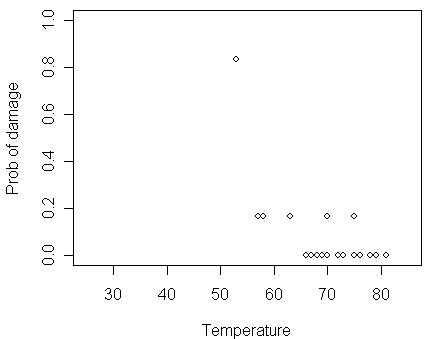
We then take a look of the data and plot the proportion of damaged O-rings against temperature.
> orings
temp damage
1 53 5
2 57 1
3 58 1
…deleted…
23 81 0
> plot(damage/6 ~ temp, orings, xlim=c(25,85), ylim = c(0,1), xlab="Temperature", ylab="Prob of damage")
The figure shows some tendency that the proportion of damage gets larger when the temperature decreases.
To build a model, a naive approach based on Normal linear model simply fit a line to this data:
>
lmod <- lm(damage/6 ~ temp, orings)
> summary(lmod)
Call:
lm(formula = damage/6 ~ temp, data = orings)
Residuals:
Min 1Q Median 3Q Max
-0.13786 -0.10345 -0.02369 0.06601 0.48345
Coefficients:
Estimate Std. Error t value Pr(>|t|)
(Intercept) 1.21429 0.29993 4.049 0.000578 ***
temp -0.01631 0.00429 -3.801 0.001043 **
---
Signif. codes: 0 '***' 0.001 '**' 0.01 '*' 0.05 '.' 0.1 ' ' 1
Residual standard error: 0.142 on 21 degrees of freedom
Multiple R-Squared: 0.4076, Adjusted R-squared: 0.3794
F-statistic: 14.45 on 1 and 21 DF, p-value: 0.001043
> abline(lmod)
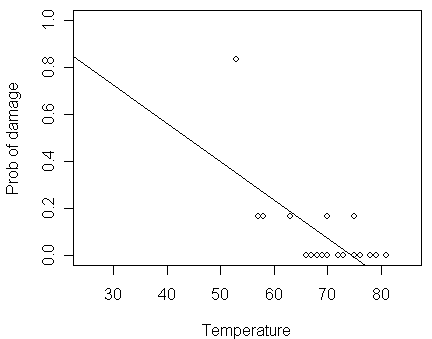
For this data set, there are several problems with this approach:
Predicted probability may be > 1 or < 0
For a binomial observation with only six trials, the Normal approximation for damage/6 is too much of a stretch
The variance of a binomial variable is not constant which violate another crucial assumption of the Normal linear model
Although we could use transformation and weighting to correct some of these problems, it is better to develop a model that is directly suited for binomial data.
We now use R to fit a binomial GLM for the data:
>
logitmod <- glm(cbind(damage,6-damage) ~ temp, family=binomial, orings)
The important points to note for the command:
For binomial response data, we need two pieces of information about the response values --- yx (the number of "successes") and nx (the number of trials). In R, one way of doing this is to form a two-column matrix with the 1st column representing yx and the 2nd column nx-yx.
We can specify the response is binomially distributed in the "family" option.
The default choice of link function is the logit --- other choices need to be specifically stated as we shall see shortly.
Now, let us take a look of the fitted model:
> summary(logitmod)
Call:
glm(formula = cbind(damage, 6 - damage) ~ temp, family = binomial, data = orings)
Deviance Residuals:
Min 1Q Median 3Q Max
-0.9529 -0.7345 -0.4393 -0.2079 1.9565
Coefficients:
Estimate Std. Error z value Pr(>|z|)
(Intercept) 11.66299 3.29626 3.538 0.000403 ***
temp -0.21623 0.05318 -4.066 4.78e-05 ***
---
Signif. codes: 0 '***' 0.001 '**' 0.01 '*' 0.05 '.' 0.1 ' ' 1
(Dispersion parameter for binomial family taken to be 1)
Null deviance: 38.898 on 22 degrees of freedom
Residual deviance: 16.912 on 21 degrees of freedom
AIC: 33.675
Number of Fisher Scoring iterations: 6
We should notice that:
The estimated GLM coefficients are given in the above output --- b0-hat=11.66 and b1-hat=-0.216 along with their respective standard errors 3.296 and 0.053.
The "z-value" (i.e., Wald test) equals (b-hat)/[se(b-hat)], which is asymptotically distributed as N(b, 1). The p-value for testing b=0 is given in "Pr(>|z|)".
The "Null deviance" is the deviance for a model with no predictors and just an intercept term (its degree of freedom equals k-1 where k is the number of covariate classes)
The "Residual deviance" is the deviance for the current model (its degree of freedom equal k-p where p is the number of parameters in the current model)
Let us compare the logit fit to the data:
>
plot(damage/6 ~ temp, orings, xlim=c(25,85), ylim = c(0,1), xlab="Temperature",
ylab="Prob of damage")
>
x <- seq(25,85,1)
Here is a function writen
by Prof. Faraway for calculating the inverse of logit transformation. You can
copy & paste it to the R console window before executing next command.
> lines(x,ilogit(11.6630-0.2162*x))
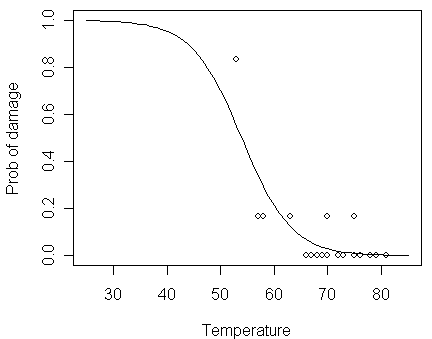
Please notice:
how the fitted probability in the logit fit tends toward zero and one at high and low temperatures, respectively
the fitted probability never actually reach 0 or 1, so the model never predicts anything to completely certain or completely impossible
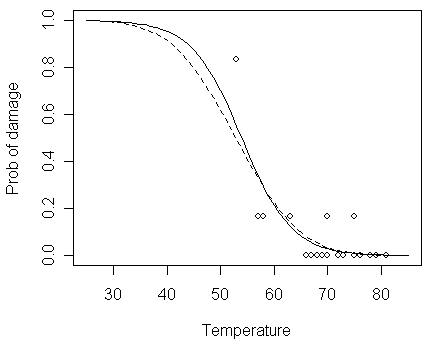
Now, let us compare the logit fit to the probit fit:
>
probitmod <- glm(cbind(damage,6-damage) ~ temp, family=binomial(link=probit),
orings)
Compare this command with that for logit fit, and
notice that how we assign the probit link function. Let us take a look of the
fitted model under the probit link:
> summary(probitmod)
Call:
glm(formula = cbind(damage, 6 - damage) ~ temp, family = binomial(link = probit), data = orings)
Deviance Residuals:
Min 1Q Median 3Q Max
-1.0134 -0.7760 -0.4467 -0.1581 1.9982
Coefficients:
Estimate Std. Error z value Pr(>|z|)
(Intercept) 5.59145 1.71055 3.269 0.00108 **
temp -0.10580 0.02656 -3.984 6.79e-05 ***
---
Signif. codes: 0 '***' 0.001 '**' 0.01 '*' 0.05 '.' 0.1 ' ' 1
(Dispersion parameter for binomial family taken to be 1)
Null deviance: 38.898 on 22 degrees of freedom
Residual deviance: 18.131 on 21 degrees of freedom
AIC: 34.893
Number of Fisher Scoring iterations: 6
Notice that:
the b0-hat=5.59 and b1-hat=-0.105 are quite different from those estimated in the logit fit (Q: should they be expected to have similar values?)
although the coefficients seem quite different, the fits are similar (as can be seen in the figure below), particularly in the range of the data
> lines(x,pnorm(5.5915-0.1058*x),lty=2)
In Jan 1986, the space shuttle Challenger exploded shortly after launch. At the time of the launch, the temperature was 31°F. We can predict the response at 31°F for both models:
> ilogit(11.6630-0.2162*31)
[1] 0.9930414
> pnorm(5.5915-0.1058*31)
[1] 0.9896029
We see a very high probability of damage with either model although we still need to develop some inferential techniques before we leap to conclusion.
Hypothesis testing in a Binomial GLM (Reading: Faraway (2006), section 2.3)
Provided that yx is truly binomial and that nx are relatively large, for a model with p parameters, the deviance D is approximately c2 with degrees of freedom k-p if the model is correct. Thus, we can use D as a goodness-of-fit measure to test whether the logit model for O-ring data is an adequate fit:
> deviance(logitmod)
[1] 16.91228
> df.residual(logitmod)
[1] 21
> pchisq(16.91228,21,lower=FALSE)
[1] 0.7164098
We see that:
this p-value >> 0.05 Þ we may conclude that this model fits sufficiently well
of course, this does not mean that this model is correct or that a simpler model might not also fit adequately
For the null model (i.e., the model with no predictors and
only an intercept term), its deviance equals 38.898 with degrees of freedom 22.
So, for the null model, the chi-square test for goodness-of-fit returns:
> pchisq(38.898,22,lower=FALSE)
[1] 0.0144964
Because the p-value < 0.05, we can see that the fit is inadequate.
Note that a c2 with degrees of freedom d has mean d and standard deviation sqrt(2d) so that it is often possible to quickly judge whether a deviance is larger or small without explicitly computing the p-value. If the deviance is far in excess of the degrees of freedom, the null hypothesis can be rejected.
We can also use the deviance to compare two nested models S and L, where SÌL. To test H0: S against H1: L\S, the test statistics is DS-DL, which is asymptotically distributed as c2 with degrees of freedom dfS-dfL assuming that the model S is correct (i.e., under null hypothesis H0). For the O-ring data, we can use this to test the significance of temperature by computing the difference in the deviances between the models with and without temperature:
the model without temperature (i.e., S) is just the null model
the model with temperature (i.e., L) is the fitted model in the object logitmod
DS=38.898 and DL=16.912
dfS=22 and dfL=21
So, the p-value of the test is:
> pchisq(38.898-16.912,1,lower=FALSE)
[1] 2.746465e-06
Notice that:
since the p-value is so small, we can conclude that the effect of launch temperature is statistically significant.
the p-value does not equal the p-value of Wald test (=4.78e-05), although there is no practical difference in this particular example
The deviance-based test can be applied to arbitrary nested models. However, when S is a model by removing only one parameter in L (i.e., H0: bi=0 for some i), an alternative test is the z-value (Wald test). In contrast to the Normal linear model, the two statistics do not generate identical p-values. For the reason of Hauck-Donner effect, the deviance-based test is usually preferred.
For the accuracy of the asymptotical approximation, the test involving differences of deviances is generally more accurate than the goodness-of-fit test involving a single deviance (notice that the latter usually has a larger degrees of freedom than the former).
To construct confidence interval for parameters, we can use the normal approximation for the parameter estimates (originated from Wald test). For example, a 95% confidence inter for the parameter of temperature in the logit model would be (1.96 is the critical value z(0.05/2)):
> c(-0.21623-1.96*0.05318,-0.2162+1.96*0.05318)
[1] -0.3204628 -0.1119672
Notice that the confidence interval does not contain zero, which is consistent with the z-value testing result.
It is also possible to construct a profile likelihood-based confidence interval (c.f., deviance-based test).
To do this, it is important to load the MASS package before using the confint command.
Otherwise, the default confint method for ordinary linear model will be used, which will not be quite right.
Before loading a package, you need to check whether the package has been added in R.
In R, to add a new package, you can do it from the "程式套件"→"安裝程式套件" in the toolbar and choose a CRAN mirror which is close to you. Then, in the Packages window, double-click on the "MASS".
> library(MASS)
> confint(logitmod)
Waiting for profiling to be done...
2.5 % 97.5 %
(Intercept) 5.5754318 18.7381243
temp -0.3326714 -0.1201767
We can see that:
the profile likelihood-based confidence interval is slightly different from the previous confidence interval in this case
the profile likelihood-based confidence interval is more away from zero than the previous confidence interval, which is consistent with the result that the deviance-based test has a smaller p-value than the Wald test in this case
the profile likelihood-based method is generally preferable for the Hauck-Donner reason although it takes more work to compute
Although we have only computed results for the logit link, the same methods would apply for the probit or other link. You should at least practice the probit case by yourself.